ELISA IS POEM
Double-Antibody Sandwich ELISA Kit Data Analysis
- Measure the optical density (OD) at two wavelengths, with the main wavelength at 450nm and the reference wavelengths at 570 nm/630 nm.
- Subtract the OD value at 570nm/630nm from the OD value at 450nm to obtain the OD value of the standard/sample. This process aims to eliminate the influence of fingerprints, watermarks, scratches, etc.
- Calculate the average OD values of the standards and samples, then subtract the OD value of the 0 concentration standard to obtain the calibrated OD value of the standard/sample.
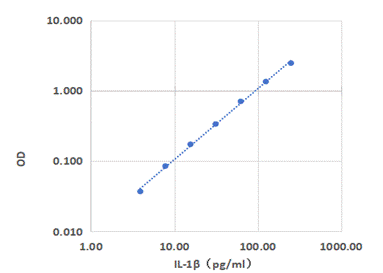
- Plot a standard curve by using the logarithm of the concentration values as the x-axis and the calibrated OD values as the y-axis. This is done through regression fitting using computer software.
- Determine the fitted concentration of the sample by inputting its calibrated OD value into the standard curve, then multiply it by the dilution factor to obtain the final concentration of the sample.
Using the Human IL-1β ELISA Kit as an example, each point on the graph represents the average value of three replicates at each concentration.
| Concentration
pg/mL |
Average OD of Standard | Calibrated OD of Standard |
|---|---|---|
| 250 | 2.463 | 2.455 |
| 125 | 1.350 | 1.342 |
| 62.5 | 0.711 | 0.703 |
| 31.25 | 0.343 | 0.335 |
| 15.63 | 0.181 | 0.173 |
| 7.81 | 0.093 | 0.085 |
| 3.91 | 0.045 | 0.037 |
| 0 | 0.008 |
ELISA IS POEM
Competitive Assay Data Analysis
- Measure the optical density (OD) at two wavelengths, with the main wavelength at 450nm and the reference wavelengths at 570 nm/630 nm.
- Subtract the OD value at 570nm/630nm from the OD value at 450nm to obtain the OD value of the standard/sample. This process aims to eliminate the influence of fingerprints, watermarks, scratches, etc.
- Calculate the average OD values of the standards and samples, then subtract the non-specific binding (NSB) OD value to obtain the calibrated OD value of the standard/sample.
- Divide the calibrated OD value of the standard/sample by the calibrated OD value of B0 (maximum bound) and multiply it by 100 to calculate the %B/B0.
- Plot a standard curve by using the concentration of the standards as the x-axis and the calibrated OD values of the calibrated standards as the y-axis. This is done through four-parameter regression fitting using computer software.
- Determine the fitted concentration of the sample by inputting its calibrated OD value into the standard curve, then multiply it by the dilution factor to obtain the final concentration of the sample.
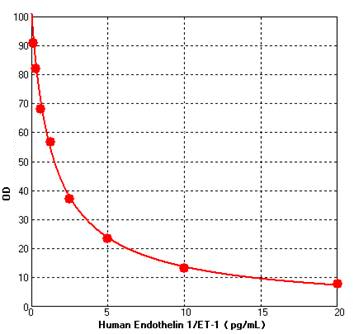
Using the Human Endothelin 1/ET-1 ELISA Kit as an example, each point on the graph represents the average value of three replicates at each concentration. The graph includes the equation and the calculated concentration plotted against the OD values.
| Concentration pg/mL | Standards Average OD | NSB | B0 | Calibrated Standard OD | %B/B |
|---|---|---|---|---|---|
| 20.00 | 0.096 | 0.008 | 1.106 | 0.088 | 7.9% |
| 10.00 | 0.154 | 0.008 | 1.106 | 0.146 | 13.2% |
| 5.00 | 0.268 | 0.008 | 1.106 | 0.260 | 23.5% |
| 2.50 | 0.417 | 0.008 | 1.106 | 0.409 | 36.9% |
| 1.25 | 0.634 | 0.008 | 1.106 | 0.626 | 56.6% |
| 0.63 | 0.761 | 0.008 | 1.106 | 0.753 | 68.1% |
| 0.31 | 0.913 | 0.008 | 1.106 | 0.905 | 81.9% |
| 0.16 | 1.012 | 0.008 | 1.106 | 1.004 | 90.8% |